Gum Branch
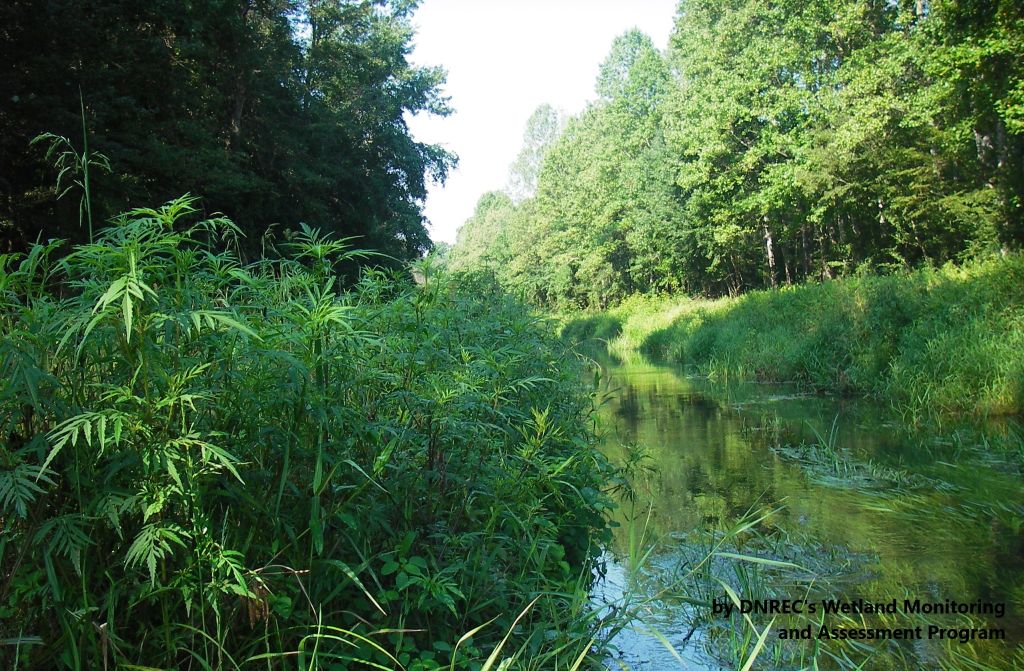
View of Gum Branch
Photo credit: DNREC’s Wetland Monitoring and Assessment Program
Photo credit: DNREC’s Wetland Monitoring and Assessment Program
Other watersheds in the Chesapeake Bay Basin
Square Miles: 30.2
Population*: 2,745
States: DE
Counties: DE: Sussex
Land use† in Gum Branch
Bohemia Creek • Broad Creek • C & D Canal West • Chester River • Choptank River • Deep Creek • Elk Creek • Gravelly Branch • Marshyhope Creek • Nanticoke River • Perch Creek • Pocomoke River • Sassafras River • Wicomico
Background
Gum Branch watershed is part of the Nanticoke River Drainage Basin.
Water Quality
Nutrients (phosphorus and nitrogen) and bacteria are problems in the Gum Branch Watershed. The DNREC Gum Branch TMDLs require a 3% reduction in bacteria loads, a 30% reduction in nitrogen loads, and a 50% reduction in phosphorus loads.
EPA established a Total Maximum Daily Load for nitrogen, phosphorus, and sediment for the entire Chesapeake Bay Watershed. This TMDL requires reductions of approximately 24% for nitrogen and 20% for phosphorus between 2009 and 2025 from all of the Chesapeake watersheds within Delaware. Sediment loads from Delaware’s portion of the Chesapeake must remain at 2009 levels under this TMDL.
EPA established a Total Maximum Daily Load for nitrogen, phosphorus, and sediment for the entire Chesapeake Bay Watershed. This TMDL requires reductions of approximately 24% for nitrogen and 20% for phosphorus between 2009 and 2025 from all of the Chesapeake watersheds within Delaware. Sediment loads from Delaware’s portion of the Chesapeake must remain at 2009 levels under this TMDL.
Plants and Wildlife
Delaware’s Department of Natural Resources and Environmental Control (DNREC), Division of Fish and Wildlife conducts on-going inventories of natural communities as well as rare and declining species, (e.g., state and globally-rare plants, birds, insects, mussels, reptiles, and amphibians). It maintains a database, both electronic and manual, of its findings throughout the state. Learn more about the wildlife and plant communities in this watershed from the DNREC Division of Fish and Wildlife Conservation Programs.
In addition, the Division of Fish and Wildlife, working with the University of Delaware’s Institute for Public Administration – Water Resources Center, maintains online databases about plants and plant communities in Delaware. Learn more about the plant communities in this watershed from the DNREC Division of Fish and Wildlife.
In addition, the Division of Fish and Wildlife, working with the University of Delaware’s Institute for Public Administration – Water Resources Center, maintains online databases about plants and plant communities in Delaware. Learn more about the plant communities in this watershed from the DNREC Division of Fish and Wildlife.
Further Resources
For more detailed information on this watershed, its water quality and resources, check out the following resources:
Delaware TMDLs
Chesapeake Watershed Implementation Plan
Delaware Watershed Plans
Delaware Whole Basin Reports
Delaware TMDLs
Chesapeake Watershed Implementation Plan
Delaware Watershed Plans
Delaware Whole Basin Reports
Gum Branch
Gum Branch quick stats
Square Miles: 30.2
Population*: 2,745
States: DE
Counties: DE: Sussex
*US Census Bureau, American Community Survey, 5-year estimates, 2019
Land use† in Gum Branch
†Land use source: U.S. Geological Survey (USGS), 2024, Annual NLCD Collection 1 Science Products (ver. 1.1, June 2025): U.S. Geological Survey data release, https://doi.org/10.5066/P94UXNTS.